
Strait of Hormuz Reopening Odds 2026: What Markets Say
Published 7 September 2026 · Prices frozen 7 September 2026, 16:30 UTC
Key takeaways
- A 2026 reopening is now a one-in-four bet. Polymarket prices Strait of Hormuz traffic returning to normal by 31 December 2026 at 24.5¢, down from 58.5¢ on 7 August — a 34-point collapse in a single month.
- The blockade ends before the ships come back. The market gives 58.45¢ to Washington announcing an end to its naval blockade by 31 December, but only 24.5¢ to traffic actually normalising by the same date — a 34-point wedge between a statement and a shipping recovery.
- “Normal” is a number, not a vibe. Resolution runs off the IMF PortWatch 7-day moving average of transit calls, and the bar is 60. Late-August days ran in single digits.
- Nobody is pricing escalation. A US invasion before 2027 sits at 14.5¢ and regime collapse at 6.5¢, while the Israel-Iran ceasefire holding through December rose to 62.5¢. The board describes a frozen conflict, not a widening one.
- Kalshi lists the identical question and nobody trades it. Its Hormuz traffic ladder uses the same PortWatch series across ten strikes, and every rung showed no bid, no ask and zero open interest.
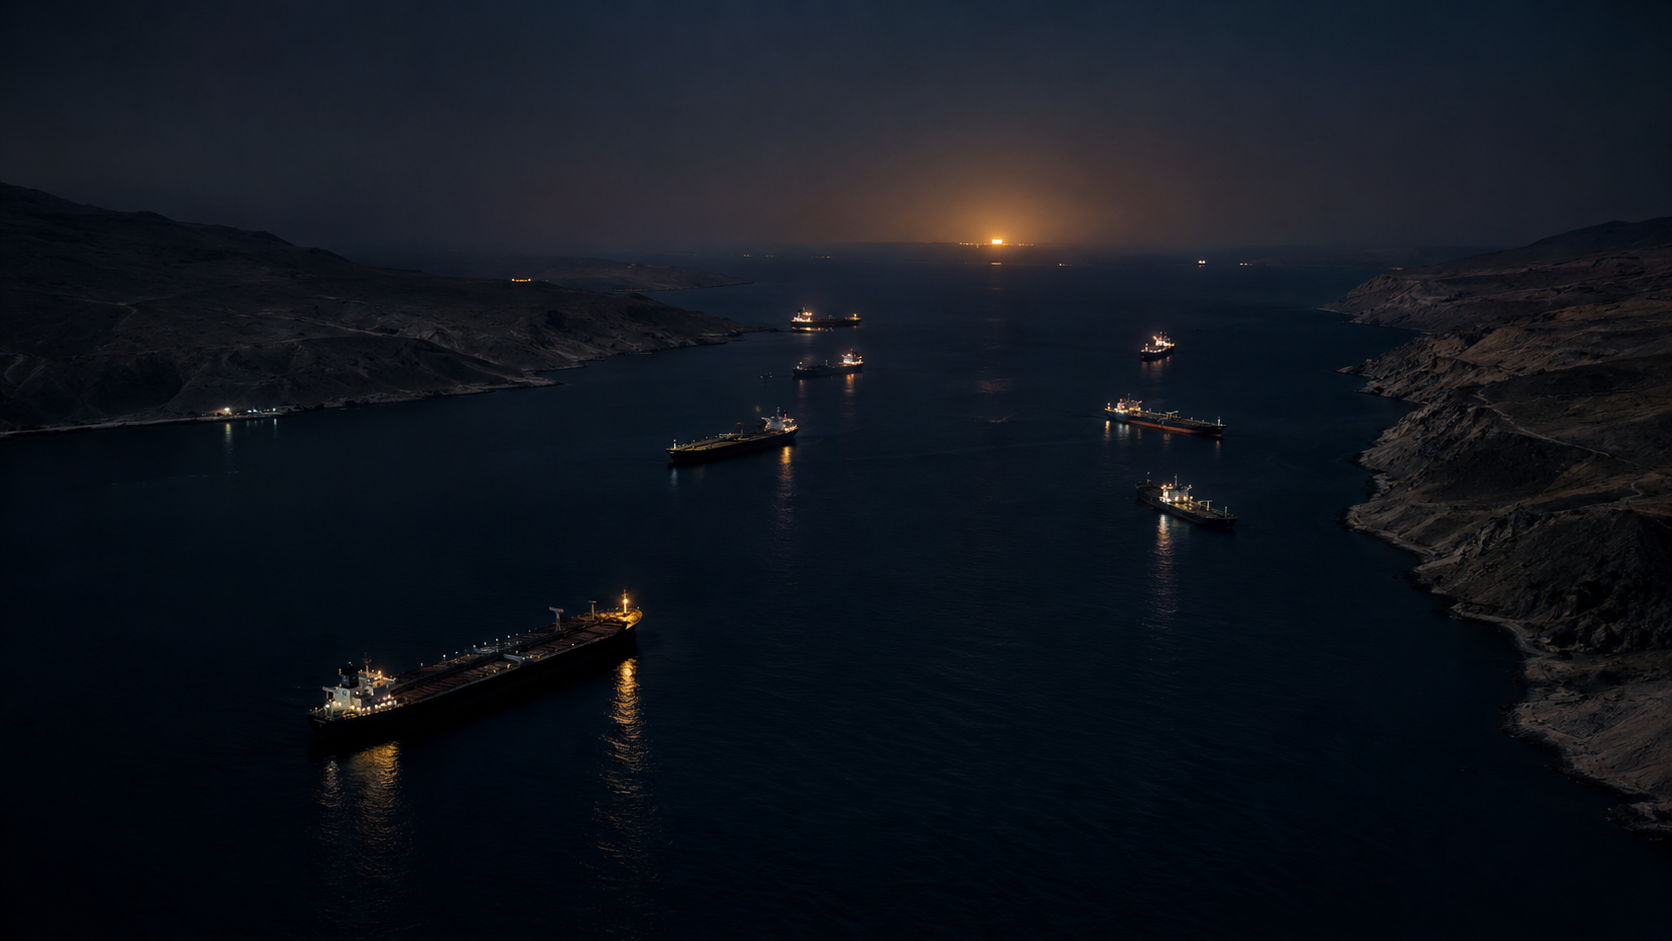
A fifth of the world’s oil normally moves through a channel about two miles wide at its narrowest shipping lanes, and it has been shut for six months. The Strait of Hormuz reopening odds are the cleanest number anyone has put on when that ends: on 7 September 2026 Polymarket paid 24.5¢ on traffic returning to normal by 31 December, against 58.5¢ a month earlier. That is the difference between an inconvenient autumn and a structural repricing of seaborne crude. We pulled every active Hormuz, blockade and Iran contract on Polymarket, read the resolution text on each one, and checked Kalshi’s competing ladder — and the most useful finding is not the headline probability but the gap between two markets that most people would assume mean the same thing.
Where the Hormuz odds stand today
The Hormuz complex on Polymarket is really three questions wearing similar clothes: when does shipping normalise, when does Washington call off the blockade, and who ends up charging whom for passage. Priced together they describe a market that expects the diplomacy to move well before the sea lanes do.
| Contract | Deadline | Yes | Volume |
|---|---|---|---|
| Hormuz traffic returns to normal | 15 Sep 2026 | 0.45¢ | $1.6m |
| Hormuz traffic returns to normal | 30 Sep 2026 | 2.15¢ | $7.9m |
| Hormuz traffic returns to normal | 31 Dec 2026 | 24.5¢ | $10.5m |
| US announces end of Iranian blockade | 30 Sep 2026 | 16.5¢ | $2.7m |
| US announces end of Iranian blockade | 31 Oct 2026 | 35.5¢ | $1.0m |
| US announces end of Iranian blockade | 31 Dec 2026 | 58.45¢ | $1.4m |
| Iran-Oman Hormuz management agreement | 31 Oct 2026 | 39¢ | $0.1m |
| Iran charges Hormuz fees | 31 Dec 2026 | 26.5¢ | $0.2m |
| US charges Hormuz fees | 31 Dec 2026 | 3.4¢ | $0.1m |
Read the ladder top to bottom and the shape is unmistakable. The September reopening contracts are effectively dead — the 30 September market at 2.15¢ is the market saying no with a rounding error attached. The year-end contract carries almost all the remaining hope, and even that one has been sliding. Meanwhile the blockade contracts price a materially better chance of a political resolution on every single deadline. That wedge is the story.
Lifting the blockade is not reopening the strait
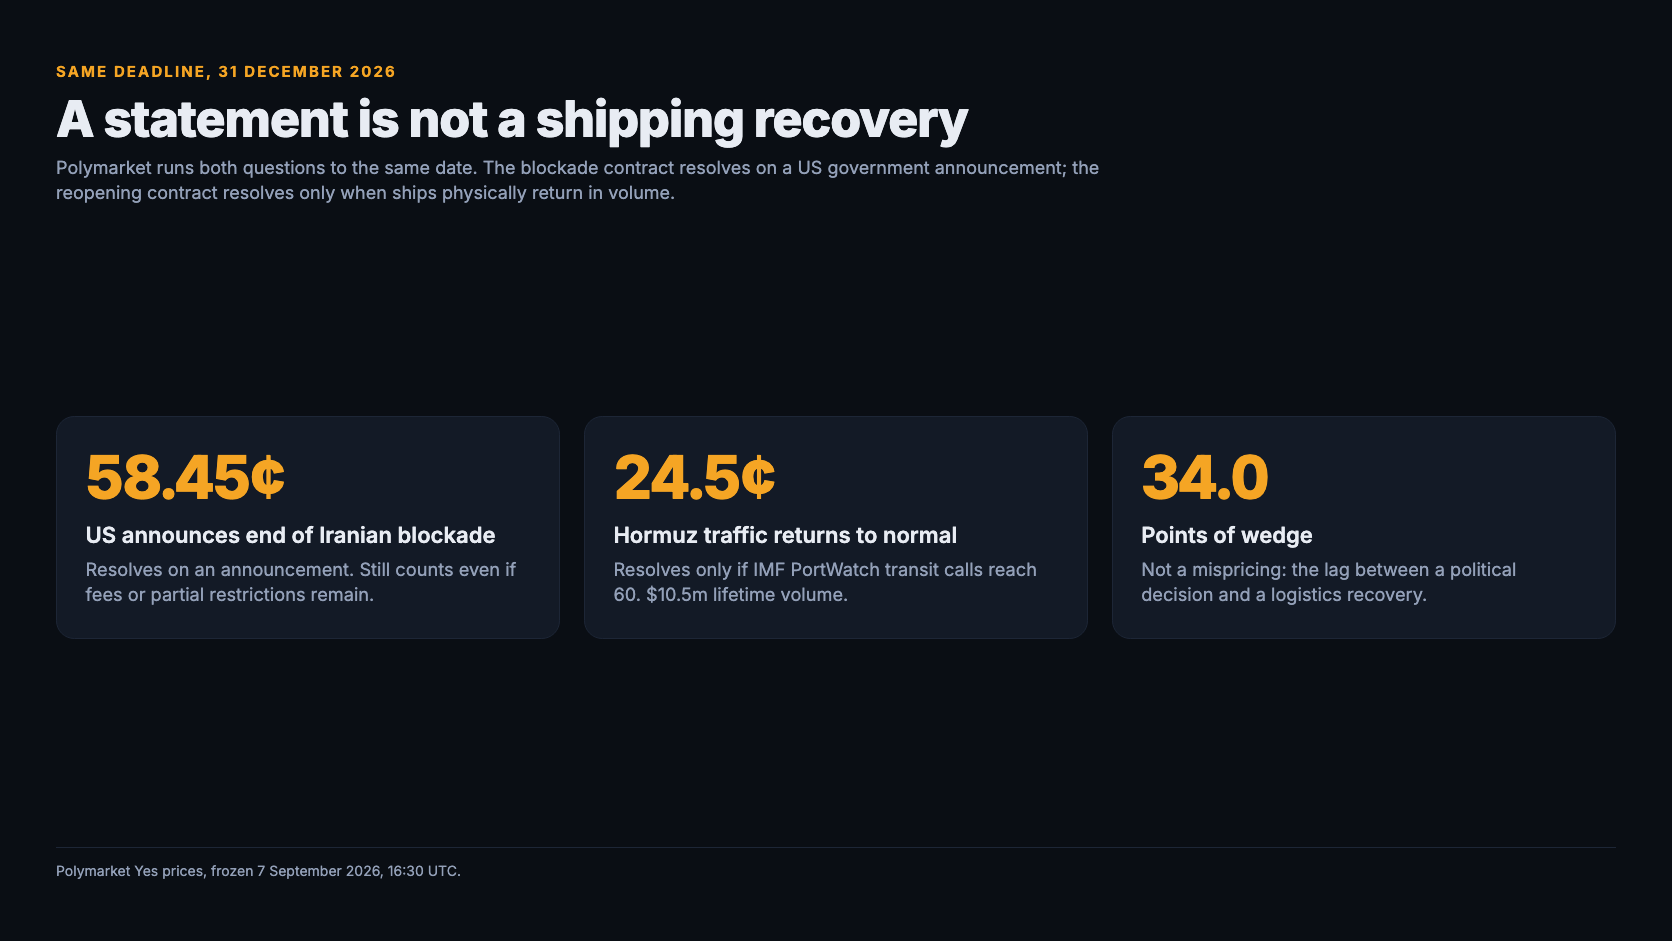
Two contracts share the 31 December deadline and disagree by 34 points. The blockade market pays 58.45¢; the reopening market pays 24.5¢. If you assume both are asking “does the Hormuz crisis end this year”, that gap looks like a mispricing you could trade. Read the rules and it stops looking like one.
The blockade contract resolves on an announcement. It needs the US government, or an authorised representative, to publicly declare the end, termination, lifting or suspension of the naval blockade. Crucially, the rules say an announcement still qualifies “even if some restrictions remain (for example, an imposition of fees)”, while a narrow carve-out for one vessel, cargo or port does not count. That is a podium and a press release — achievable in an afternoon if the politics line up.
The reopening contract resolves on ships. It needs a physical recovery in traffic large enough to show up in a satellite-derived weekly average. Between the announcement and that recovery sit mine clearance, war-risk insurance underwriting, charterer confidence and the rerouting decisions of carriers who have already redrawn their networks. None of those move at the speed of a statement.
What “back to normal” actually means: the number 60
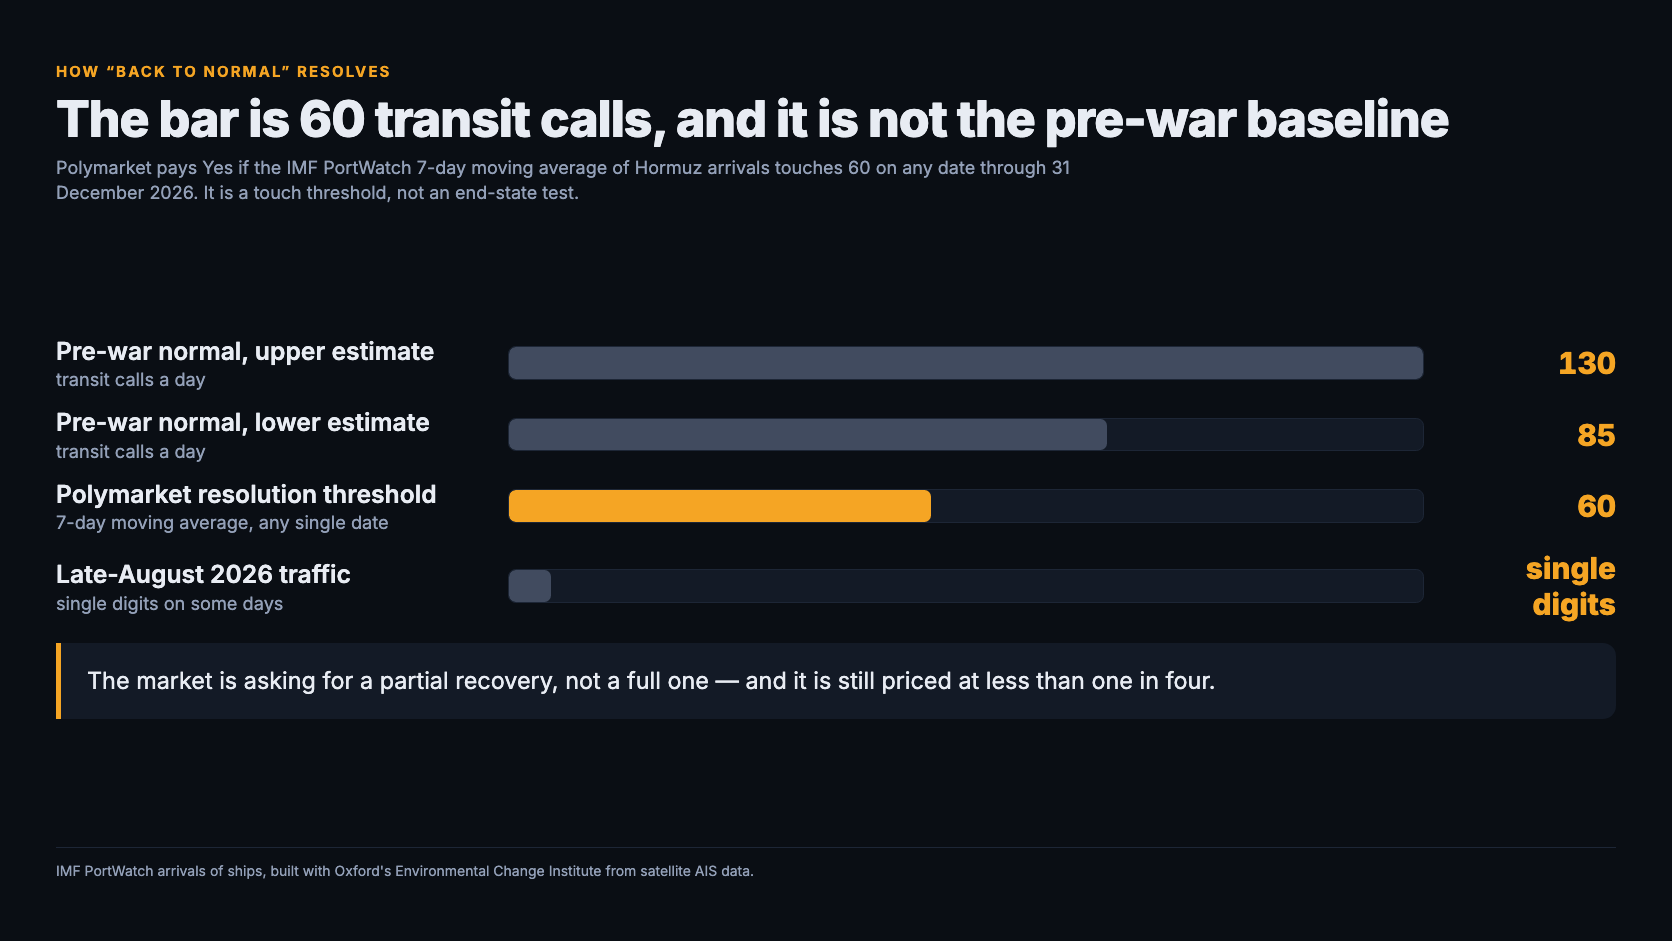
Resolution criteria are where these markets are won and lost, and this one is refreshingly mechanical. Polymarket resolves Yes if IMF PortWatch publishes a 7-day moving average of transit calls (“Arrivals of Ships”) equal to or above 60 for any date through 31 December 2026. PortWatch is built by the IMF with Oxford’s Environmental Change Institute from satellite AIS data and updates weekly, and the count includes container, dry bulk, roll-on/roll-off, general cargo and tanker vessels.
Two features of that wording matter for anyone holding the contract. First, it is a touch threshold, not an end-state test: a single qualifying date resolves the market Yes, so one good week in December pays the same as a durable recovery. Second, 60 is not the pre-war baseline. Trackers put normal Hormuz traffic somewhere between roughly 85 and 130 transit calls a day depending on which series you read, so the market is asking for a partial recovery, not a full one — and it is still priced at less than one in four.
| Feature | Polymarket | Kalshi |
|---|---|---|
| Question shape | Binary by deadline | Ladder, 10 strikes |
| Data source | IMF PortWatch 7-day MA | IMF PortWatch 7-day MA |
| Threshold | 60 transit calls | 30 to 120, in tens |
| Window | Through 31 Dec 2026 | 6 Jul 2026 – 1 Jan 2027 |
| Trigger | Any single qualifying date | Any single qualifying date |
| Live pricing | 24.5¢ year-end | No bid, no ask |
Because both venues resolve off the identical series, Polymarket’s binary is functionally Kalshi’s “Above 60” rung. That is an unusually clean cross-exchange mapping — the kind our matching methodology exists to find. It just happens that only one side of it has a price.
Kalshi lists the same question — and nobody trades it
Kalshi’s KXHORMUZAVG-27JAN01 asks how high the average weekly Hormuz traffic gets in 2026, laddered from “Above 30” to “Above 120”. A ladder is strictly more informative than a binary: the spacing between rungs implies a whole distribution rather than a single probability. In practice it tells us nothing here, because on 7 September 2026 every one of the ten strikes returned no bid, no ask, no volume and no open interest.
This is worth stating plainly rather than dressing up as a comparison. We will not print a cross-exchange gap built on an empty book, and GeoOdds hides its Kalshi module whenever the match or the liquidity does not support it. The honest read is that the informative Hormuz price currently exists on exactly one venue, and a 24.5¢ mark backed by $10.5m of lifetime volume is the only number here doing real work.
The month the market gave up on a fast reopening
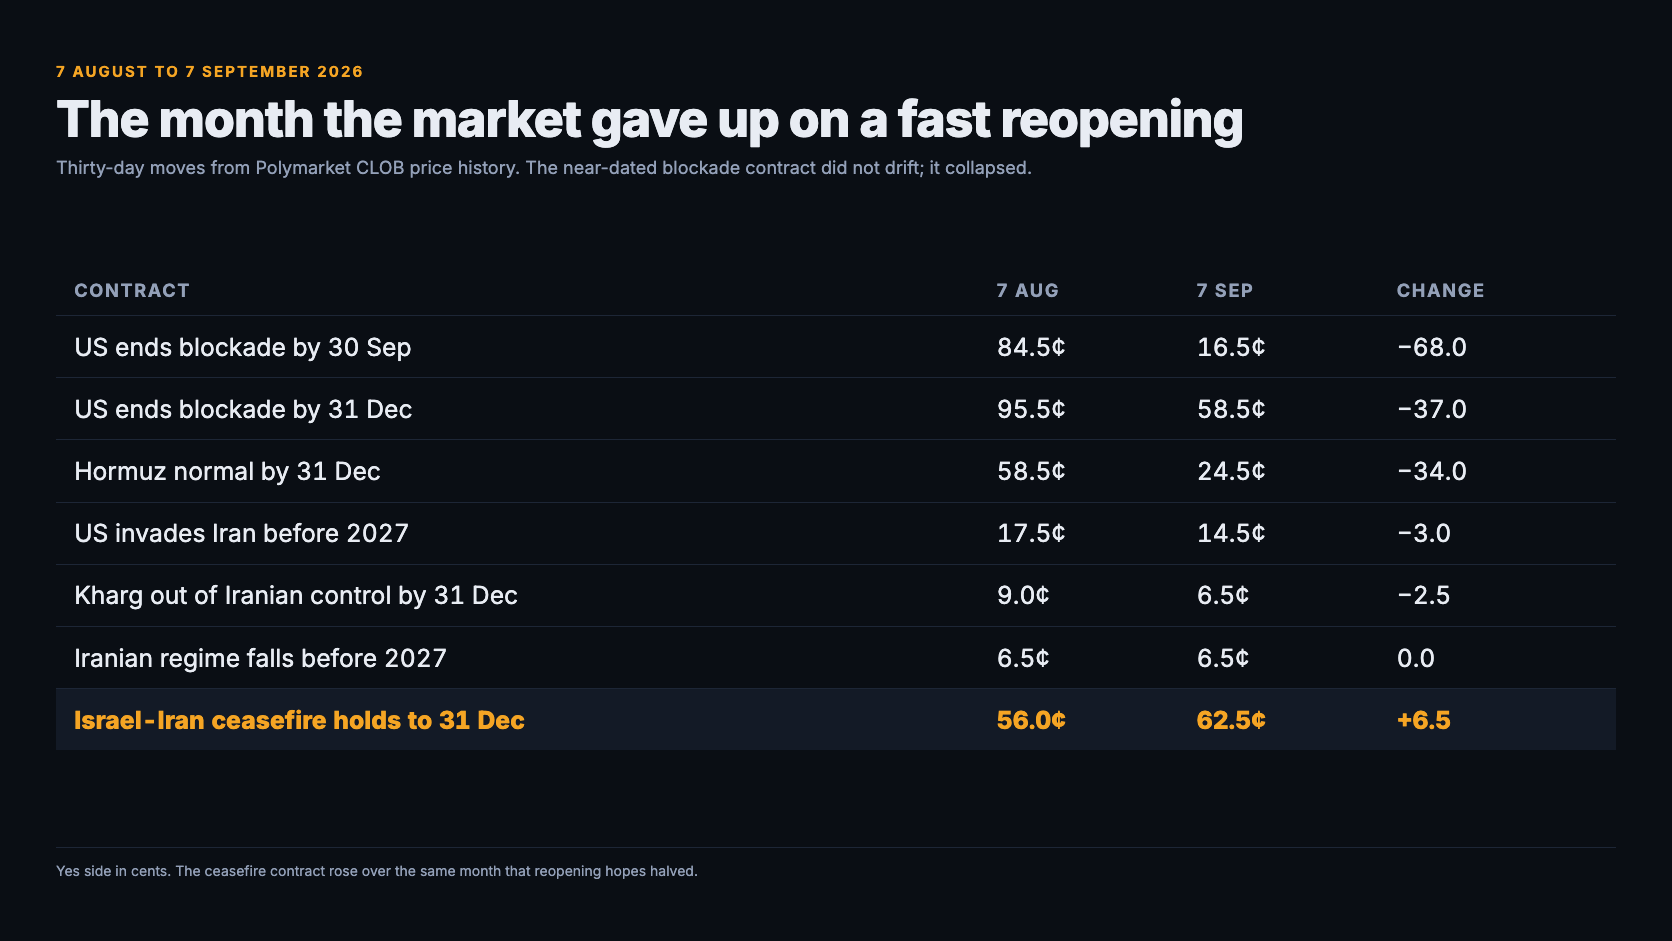
August was brutal for anyone long a quick resolution. Comparing 7 August with 7 September on the CLOB price history, the near-dated contracts did not drift — they collapsed.
| Contract | 7 Aug | 7 Sep | Change |
|---|---|---|---|
| US ends blockade by 30 Sep | 84.5¢ | 16.5¢ | −68.0 |
| US ends blockade by 31 Dec | 95.5¢ | 58.5¢ | −37.0 |
| Hormuz normal by 31 Dec | 58.5¢ | 24.5¢ | −34.0 |
| US invades Iran before 2027 | 17.5¢ | 14.5¢ | −3.0 |
| Kharg out of Iranian control by 31 Dec | 9.0¢ | 6.5¢ | −2.5 |
| Iranian regime falls before 2027 | 6.5¢ | 6.5¢ | 0.0 |
| Israel-Iran ceasefire holds to 31 Dec | 56.0¢ | 62.5¢ | +6.5 |
The 68-point fall in the 30 September blockade contract is the sharpest repricing on the board, and it maps onto real events rather than sentiment. The US confirmed clearing over 100 suspected mines from the Traffic Separation Scheme on 25 August, which should have been bullish — then maritime hostilities intensified from 31 August, US Central Command struck IRGC targets on 1 September, and around 5 September US forces hit three Iranian crude carriers near Kharg Island following missile attacks on Navy ships. Mine clearance is necessary but nowhere near sufficient when the shooting resumes on top of the cleared lanes.
Why ceasefire odds rose while reopening odds fell
The counterintuitive line in that table is the last one. Over the same month that reopening hopes halved, the Israel-Iran ceasefire contract went up, from 56¢ to 62.5¢ for holding through 31 December. Escalation contracts stayed flat or fell: a US invasion before 2027 eased to 14.5¢ and the Iranian regime falling sat unchanged at 6.5¢.
Put those together and the market is not forecasting a war or a peace. It is forecasting a frozen conflict: no invasion, no regime collapse, no return of the ships. Tanker strikes and CENTCOM raids are being read as the steady state of a contained confrontation rather than the opening of a wider one. That is a coherent view, and it is the single assumption most likely to be wrong — a frozen conflict is a description of the present, and markets are generally worse at pricing the moment a stalemate breaks than at extrapolating one that has held for months.
Kharg Island: the 6.5¢ market behind Iran’s export collapse
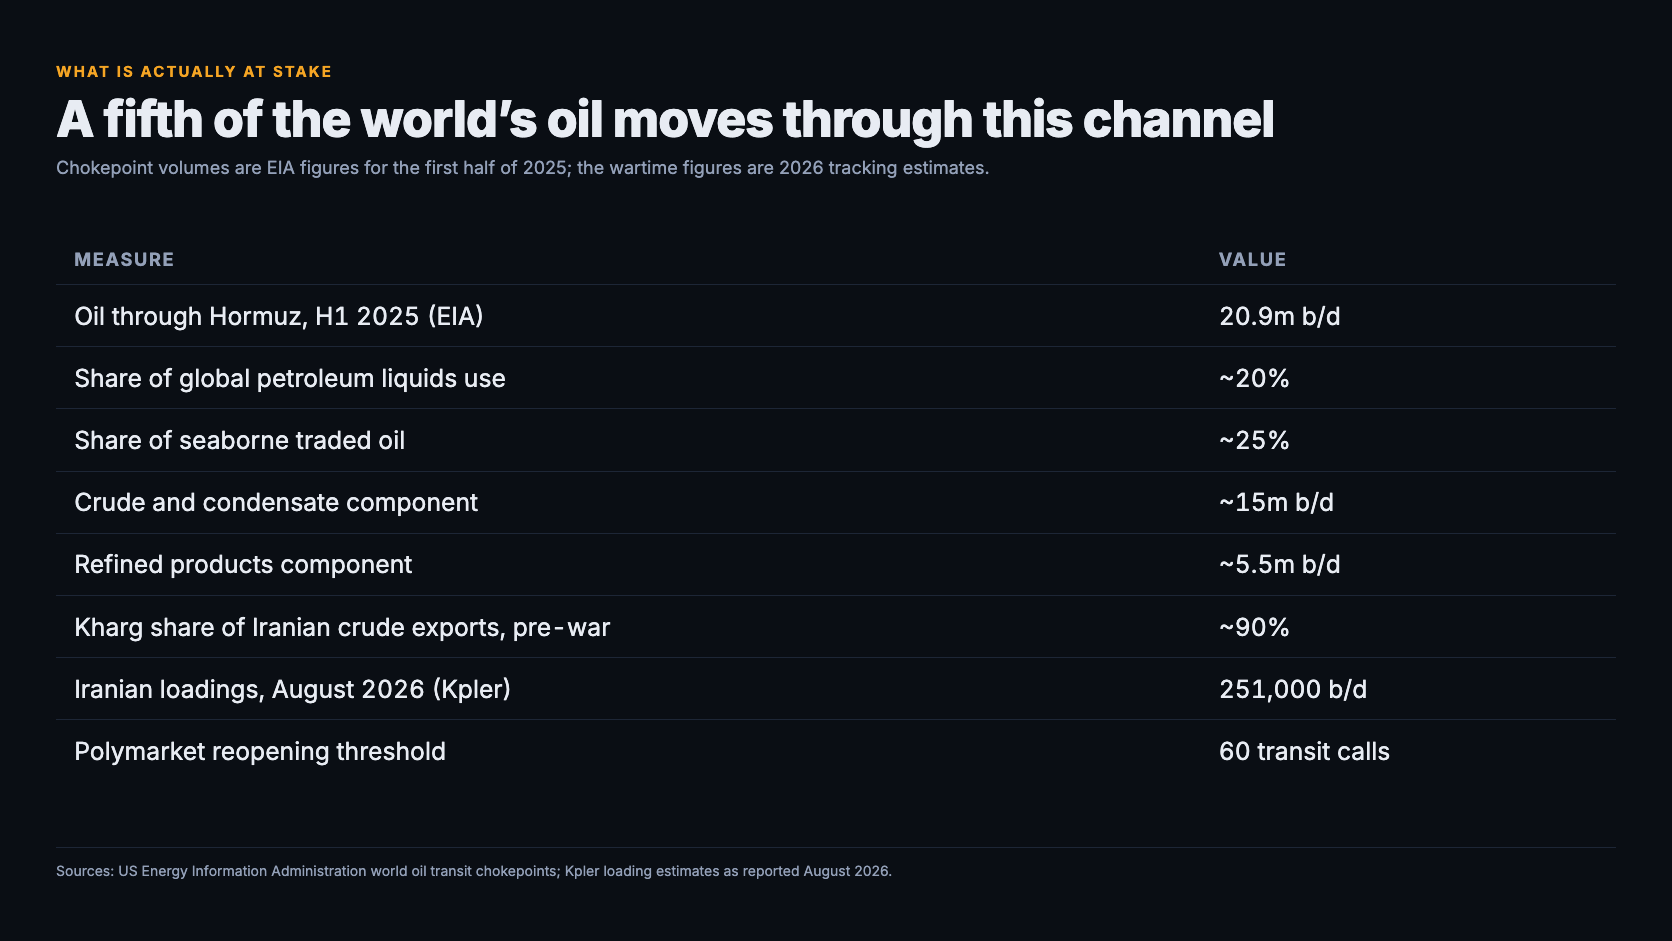
Kharg Island handled roughly 90% of Iranian crude exports before the war, which is why the market on it leaving Iranian control has attracted $72.8m in event volume despite pricing at just 6.5¢ for 31 December. Traders are not betting the island changes hands. They are betting on the tail — and paying to watch it.
The physical picture explains why the tail stays a tail. Iran loaded about 251,000 barrels a day in August according to Kpler, a fraction of pre-war throughput, and stocks held at Kharg fell by 550,000 barrels to 19.45m. The terminal is being strangled commercially rather than captured militarily: US strikes on 13 March deliberately spared oil and gas infrastructure while hitting military sites. A blockade that leaves the asset intact but unusable is cheaper than an occupation, and it prices very differently.
| Measure | Value |
|---|---|
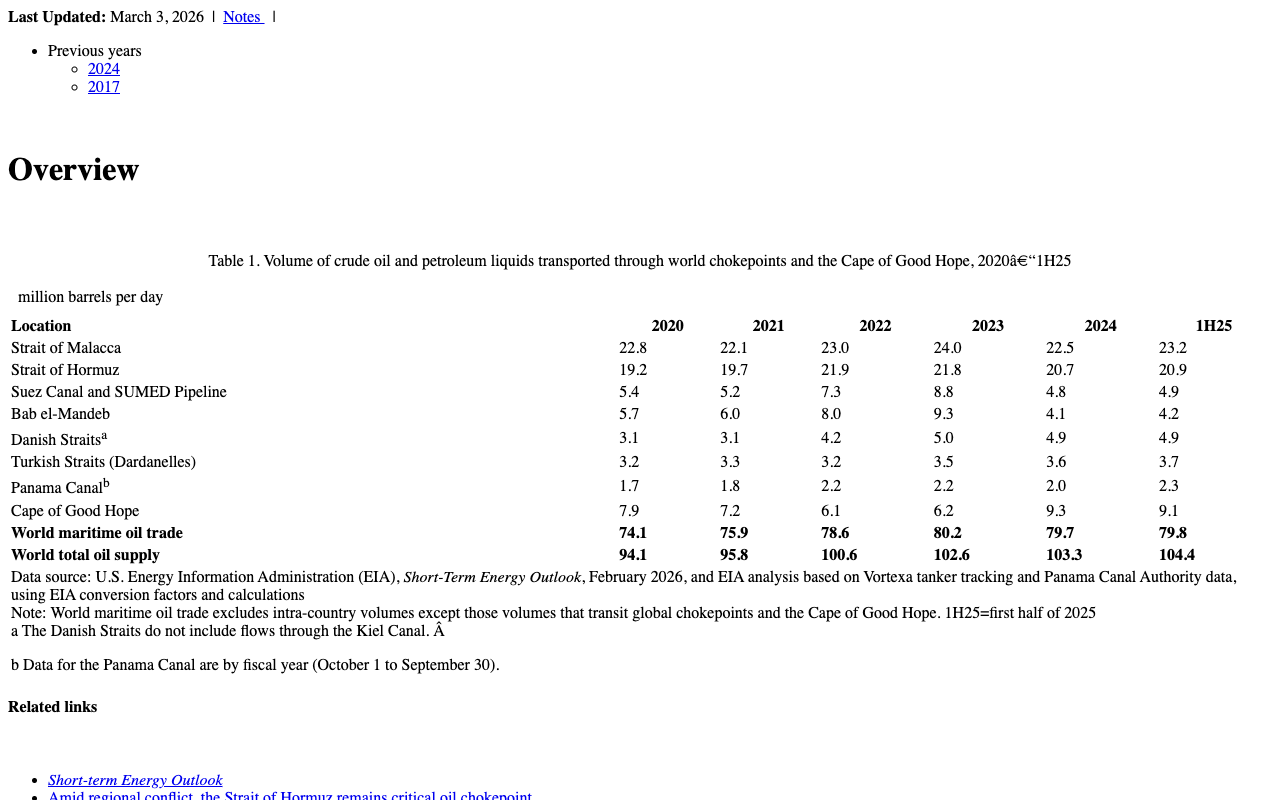
| Oil through Hormuz, H1 2025 (EIA) | 20.9m b/d |
| Share of global petroleum liquids use | ~20% |
| Share of seaborne traded oil | ~25% |
| Crude and condensate component | ~15m b/d |
| Refined products component | ~5.5m b/d |
| Kharg share of Iranian crude exports, pre-war | ~90% |
| Iranian loadings, August 2026 (Kpler) | 251,000 b/d |
| Polymarket reopening threshold | 60 transit calls |
What could move these odds before December
Four things would reprice this board, and only one of them is military. The first is the Oman track: an Iran-Oman Hormuz management agreement by 31 October sits at 39¢, down from 60.5¢ on 29 August but still the most probable diplomatic mechanism on the board. A negotiated co-management of the strait is the cleanest path from blockade to traffic.
The second is the fee regime. Remember that the blockade market resolves Yes even if fees remain — and Iran charging Hormuz fees by year-end prices at 26.5¢ against 3.4¢ for the US doing so. A world where the blockade formally ends and Tehran starts charging for passage is both internally consistent and, on these prices, more likely than a genuine return to normal traffic. Third is insurance: war-risk premiums reported at roughly 40 times normal rates, with four of the nine largest container carriers off the route, are the mechanism that keeps the reopening contract low even after good political news.
The fourth is escalation, and the market is quietly clear that it is not the base case. The IMO reported around 1,000 ships and 20,000 crew stranded in the Gulf by mid-June, with 46 confirmed attacks and 14 seafarer deaths — a humanitarian toll that has so far moved the ceasefire contract more than the invasion one. If you want a single number to follow into year-end, make it the year-end reopening price: at 24.5¢ it is the market’s honest estimate that this ends in 2026, and it has been falling all month.
Related on GeoOdds
- Iran odds hub — every active Iran market in one place
- Strait of Hormuz traffic returns to normal by 31 December — live odds
- US announces end of Iranian blockade — live odds and chart
- Israel-Iran ceasefire continues through — live probability
- Polymarket vs Kalshi: Venezuela leader odds — the same cross-exchange method
- Methodology — how we match Polymarket and Kalshi markets
New to prediction markets?
New traders get a $20 bonus
Deposit $10 on Polymarket and get a $20 trading bonus to put behind your first call.
See the Hormuz market on Polymarket →New Polymarket users only. Bonus is trading credit, expires 30 days after it lands, and terms are set by Polymarket — check the current offer at signup. 18+. Fee-free markets. GeoOdds earns a commission on signups through this link.
Frequently asked questions
Is the Strait of Hormuz open in September 2026?
Not in any commercial sense. Iran closed the strait to “unfriendly nations” on 28 February 2026 and the United States has run a naval blockade of Iranian ports and their customers since 13 April, reinstated on 13 July after an interim ceasefire collapsed. Transit calls have fallen to single digits on some days against a pre-war baseline that trackers put somewhere between 85 and 130 ships a day.
What odds do prediction markets give the Strait of Hormuz reopening in 2026?
Polymarket priced a return to normal traffic by 31 December 2026 at 24.5¢ on 7 September 2026 — roughly a one-in-four chance. The nearer deadlines are close to written off: 2.15¢ by 30 September and 0.45¢ by 15 September. A month earlier the year-end contract traded at 58.5¢, so the market has more than halved its confidence in a 2026 reopening.
Why does the market think the blockade ends before the strait reopens?
Because they are different events with different resolution criteria. The blockade market resolves on a US government announcement — a political act that can happen in an afternoon, and which still counts even if fees or partial restrictions remain. The reopening market resolves only when ships physically return in volume. On 7 September the gap was 58.45¢ against 24.5¢ for the same 31 December deadline.
How is “Strait of Hormuz traffic returns to normal” actually resolved?
Polymarket resolves it against IMF PortWatch, which publishes a 7-day moving average of transit calls (“Arrivals of Ships”) built from satellite AIS data. The market pays Yes if that average reaches 60 or more on any date through 31 December 2026, counting container, dry bulk, roll-on/roll-off, general cargo and tanker vessels. It is a data threshold, not a judgement call about whether the strait feels open.
Does Kalshi have a Strait of Hormuz market?
Yes — KXHORMUZAVG-27JAN01 asks how high the average weekly Hormuz traffic gets in 2026, using the same IMF PortWatch 7-day moving average as Polymarket, laddered from “Above 30” to “Above 120”. As of 7 September 2026 none of the ten rungs showed a bid, an ask, volume or open interest, so the ladder is listed rather than traded and carries no usable price.
What would have to happen for the strait to reopen before year-end?
Three things in sequence: a political settlement or announced end to the blockade, physical mine clearance in the Traffic Separation Scheme, and war-risk insurance falling far enough that carriers route ships back. The US confirmed clearing over 100 suspected mines on 25 August 2026, which addresses only the middle step. Insurance and carrier confidence are the slow parts, and they are why the reopening market lags the blockade market.
Do prediction markets expect a wider US-Iran war in 2026?
No. On 7 September 2026 Polymarket priced a US invasion of Iran before 2027 at 14.5¢ and the Iranian regime falling before 2027 at 6.5¢, both roughly flat or slightly lower over the previous month. The Israel-Iran ceasefire holding through 31 December actually rose to 62.5¢. The market is pricing a frozen, contained conflict rather than an escalating one.
Sources: Polymarket Gamma and CLOB public APIs (events 455875, 660109, 830255, 699735, 711714, 73130, 72347, 267102, 798490, 794064, 634801, 699298); Kalshi public trading API (KXHORMUZAVG-27JAN01); US Energy Information Administration world oil transit chokepoints; IMF PortWatch; NBC News Hormuz traffic tracker; Kpler loading estimates as reported August 2026; IMO seafarer statements, June 2026. Prices captured 7 September 2026, 16:30 UTC and not updated since. Nothing here is investment advice — see our disclaimer.