
Bab el-Mandeb Odds 2026: Right Number, Wrong Strait
Published 13 November 2026 · Prices frozen 13 November 2026, 21:07 UTC
Key takeaways
- The threshold has never been met once in 2,869 days. Polymarket’s contract resolves Yes only if the IMF PortWatch 7-day average of Bab el-Mandeb arrivals falls to 10 or fewer. Across every published daily record from 1 January 2019 to 8 November 2026, the lowest that average has ever been is 23.71.
- Hormuz clears the same bar every day — 216 days at or below 10 since 7 March 2026, including an unbroken 118-day run to 8 November 2026, now reading 3.86. The strait with the closure contract is open; the strait with the reopening contract is shut.
- Houthi control of the strait moved the number by nothing. The 7-day average read 27.29 on 13 September, the day Al Jazeera reported the coastline takeover complete — above the 23.71 low set twelve days before it.
- Every price on the first page of search is stale. Published snapshots still quote 21–33%. The 31 December rung traded at 7.5¢ at our snapshot, after 11 earlier rungs settled No.
- Kalshi has nothing to compare — no Bab el-Mandeb series at all, two dead 2024 Red Sea series, and a Hormuz ladder on the identical dataset with ten active rungs and zero open interest.
Look up the Bab el-Mandeb odds and the first page of results will tell you the market gives a closure somewhere between 21% and 33%. Those numbers were true in July and September. The 31 December contract traded at 7.5¢ when we froze this page, and eleven earlier rungs on the same board have already settled No.
The gap matters more than the staleness, because none of those write-ups checks the one thing that decides the bet. “Effectively closed” is not a judgement call here — it is a published number with a published threshold, and that number is free to look up. So we looked it up.
We pulled every daily transit record the IMF publishes for the strait back to 1 January 2019 — 2,869 days — and computed the exact 7-day moving average the contract names. It has never once been at or below 10. What it has done, continuously since July, is sit below 10 at the other end of the Arabian Peninsula, where Polymarket is running the opposite bet.
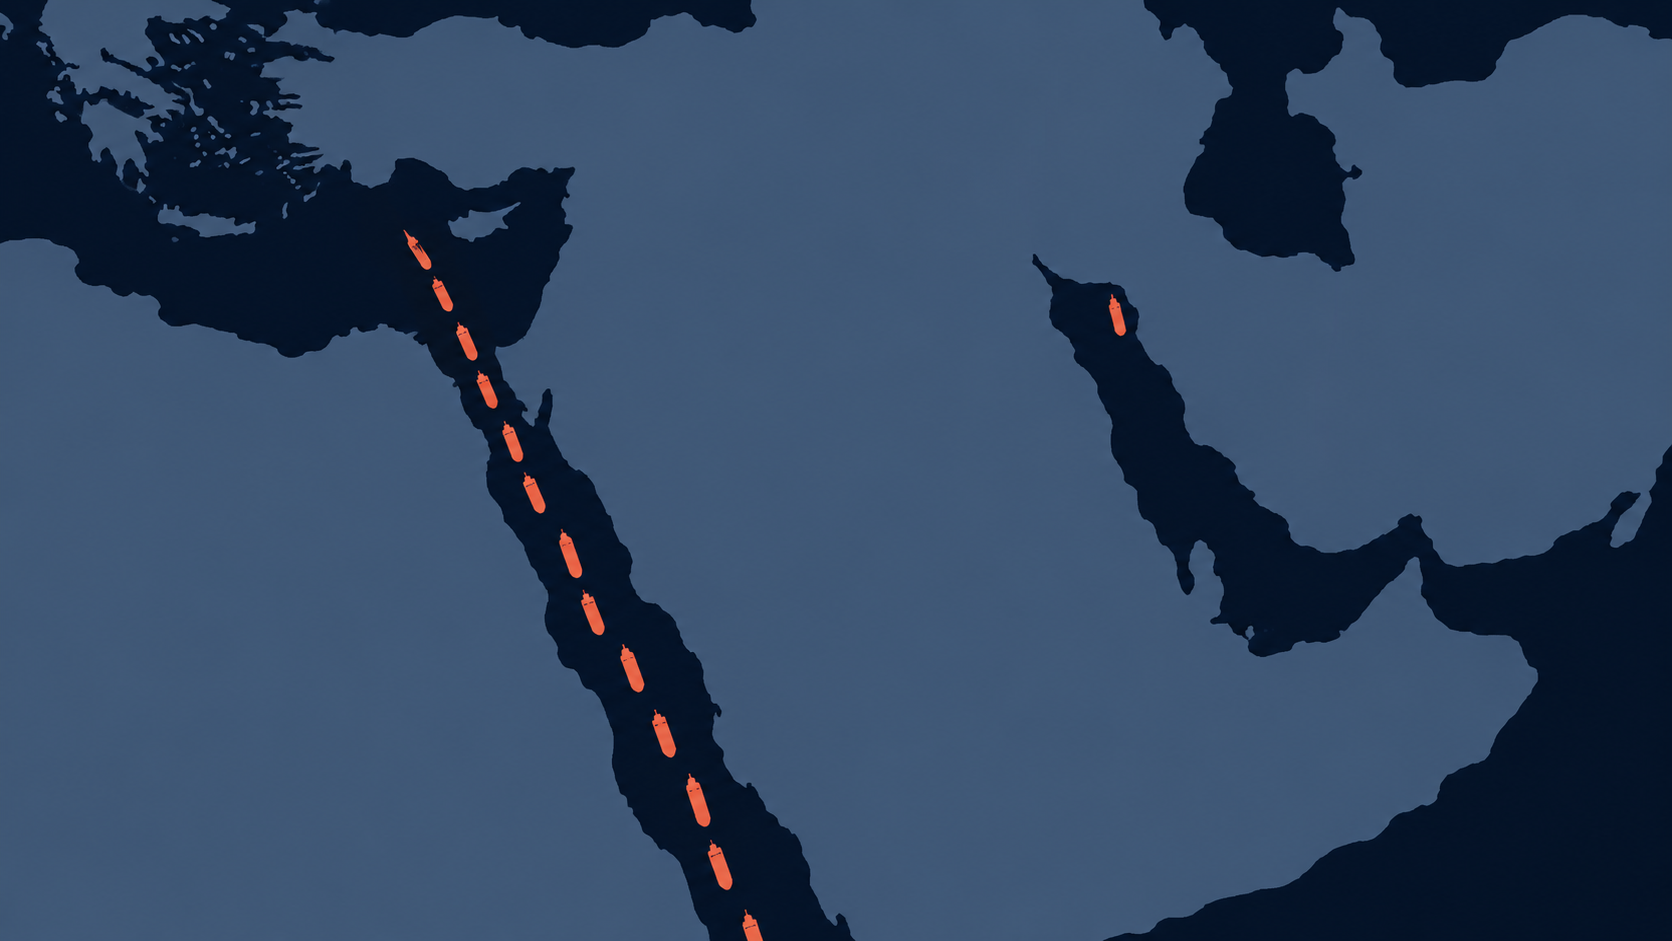
Where the Bab el-Mandeb odds stand today
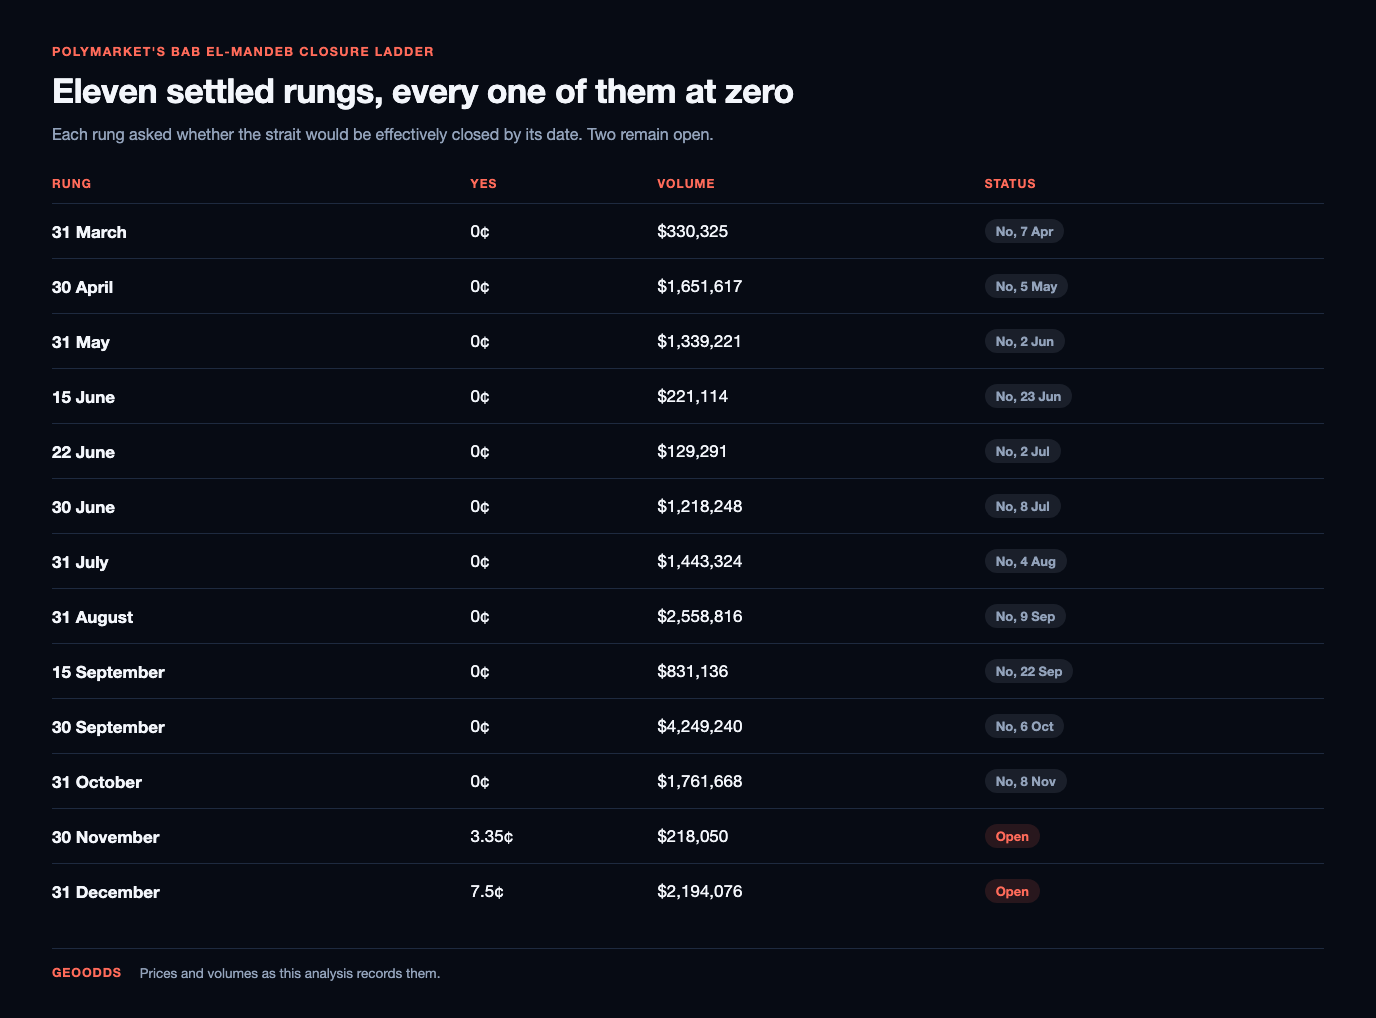
The board is a date ladder: one rung per deadline, each asking whether the strait will have been effectively closed by then. It has been running since 16 March 2026 and has taken $18.1 million in volume, which makes it one of the larger shipping contracts anywhere. Eleven of its thirteen rungs are finished, and every one of them finished the same way.
| Rung | Yes | Volume | Status |
|---|---|---|---|
| 31 March | 0¢ | $330,325 | No — 7 Apr |
| 30 April | 0¢ | $1,651,617 | No — 5 May |
| 31 May | 0¢ | $1,339,221 | No — 2 Jun |
| 15 June | 0¢ | $221,114 | No — 23 Jun |
| 22 June | 0¢ | $129,291 | No — 2 Jul |
| 30 June | 0¢ | $1,218,248 | No — 8 Jul |
| 31 July | 0¢ | $1,443,324 | No — 4 Aug |
| 31 August | 0¢ | $2,558,816 | No — 9 Sep |
| 15 September | 0¢ | $831,136 | No — 22 Sep |
| 30 September | 0¢ | $4,249,240 | No — 6 Oct |
| 31 October | 0¢ | $1,761,668 | No — 8 Nov |
| 30 November | 3.35¢ | $218,050 | Open |
| 31 December | 7.5¢ | $2,194,076 | Open |
Eleven settled rungs at zero is not a market that has been wrong; it is a market that has been repeatedly right about a thing not happening. The two live rungs price the same thing happening in the time left — 17 days for one, 48 for the other. Both are worth reading against the resolution text rather than the headline.
What “effectively closed” means: the number 10
Polymarket does not ask whether the strait feels shut, whether a government has declared it closed, or whether anyone is shooting. The operative sentence is a measurement:
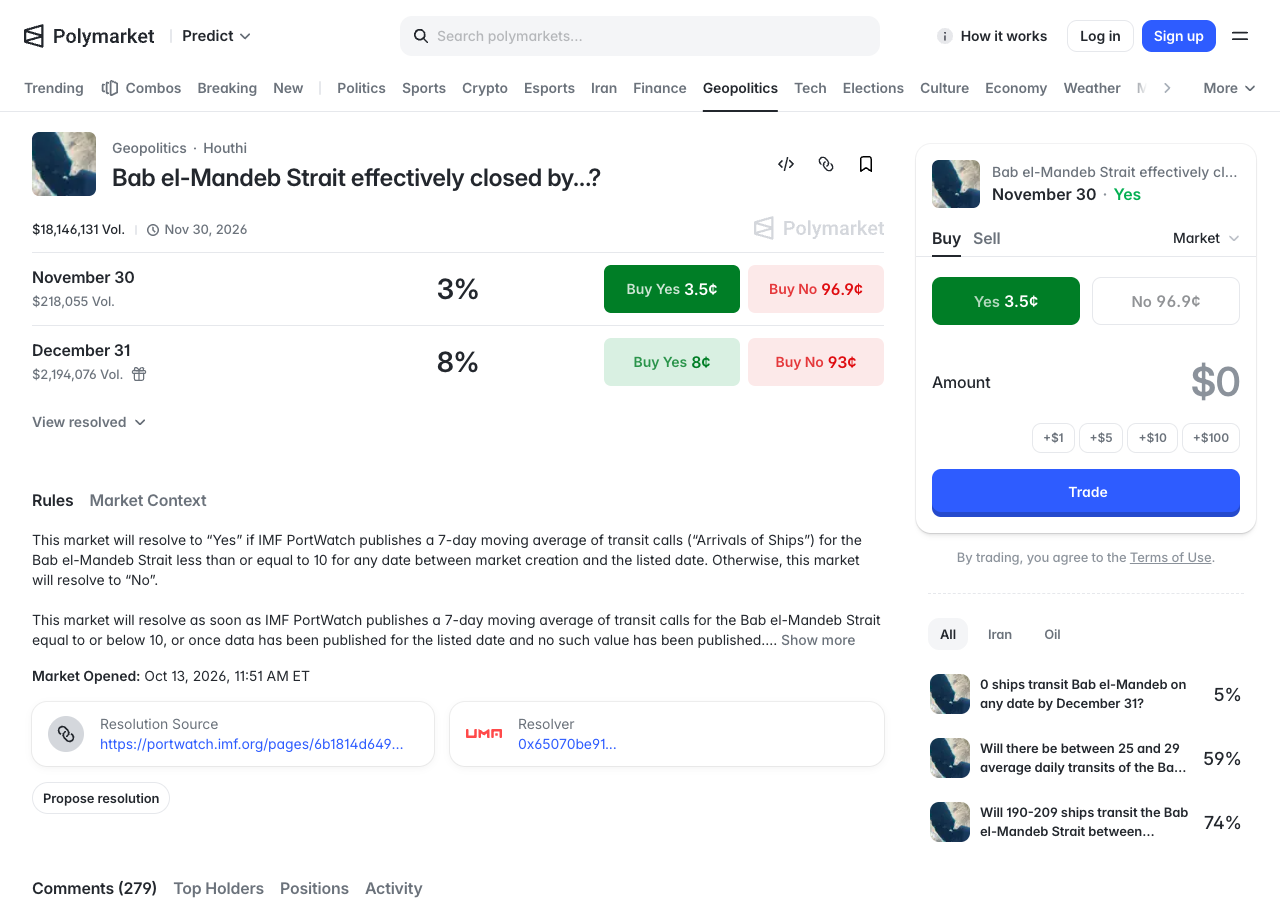
Three things follow from that, and all three are routinely skipped. The first is the counting rule: container, dry bulk, roll-on/roll-off, general cargo and tanker vessels all count, and ships PortWatch does not report do not count at all. A tanker-only tracker showing three transits is not evidence about this contract.
The second is the window, which starts at each rung’s own creation, not the event’s. The 31 December rung was created on 9 July 2026, so any qualifying reading from 9 July onward pays it. The 30 November rung only came into being on 13 October.
The third is the lag. PortWatch publishes about five days behind: on 13 November the latest available date was 8 November 2026. That matters for the arithmetic, because the live question is not what happens in 48 days but what the 53 days of still-unpublished data from 9 November to 31 December will show.
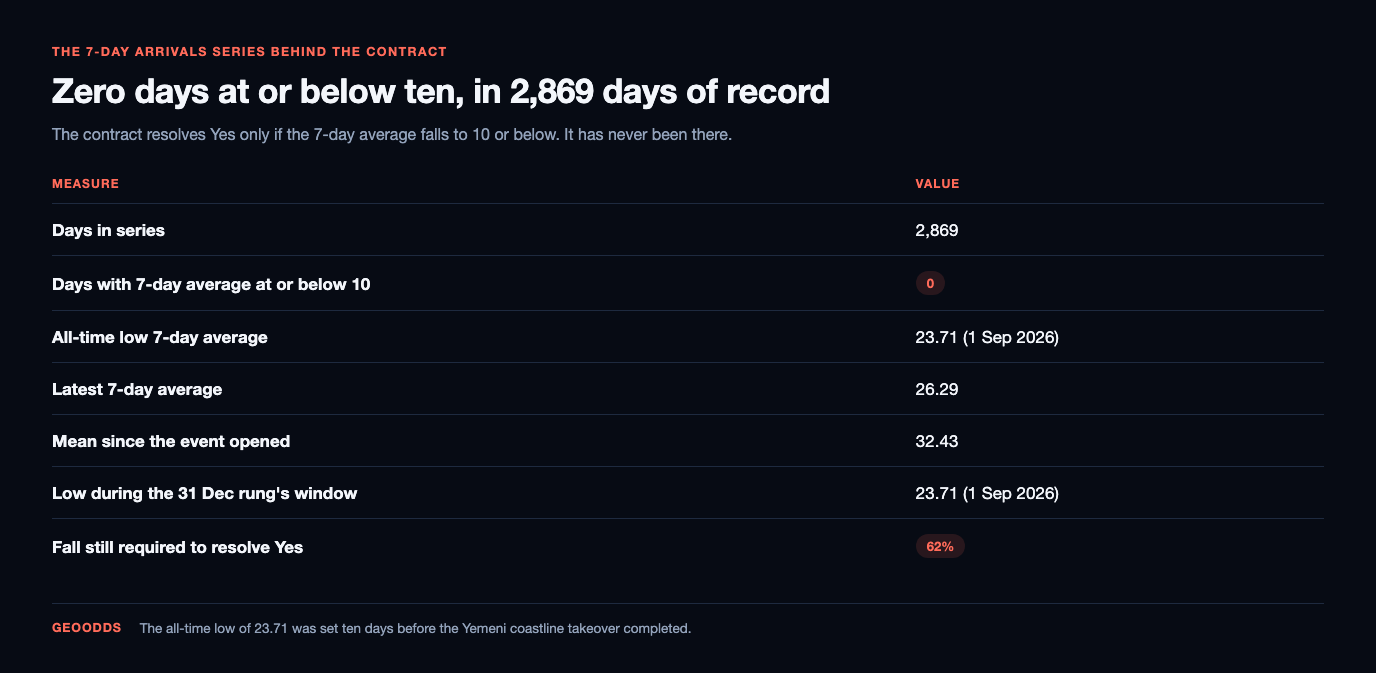
That number has never been hit — not once in 2,869 days
PortWatch is not a paywalled feed. The daily chokepoint series sits in a public ArcGIS feature service, one row per strait per day, and it goes back to the start of 2019. We took all of it for Bab el-Mandeb, recomputed the 7-day average, and asked the only question that settles the contract: how often has it been 10 or less?
| Measure | Value |
|---|---|
| Days in series | 2,869 |
| Days with 7-day average ≤ 10 | 0 |
| All-time low 7-day average | 23.71 (1 Sep 2026) |
| Latest 7-day average | 26.29 (8 November 2026) |
| Mean since the event opened | 32.43 |
| Low during the 31 Dec rung's window | 23.71 (1 Sep 2026) |
| Fall still required to resolve Yes | 62% |
Zero. Not during the 2024 Houthi missile campaign that pushed half the world’s container fleet around the Cape of Good Hope, not during this autumn’s ground offensive. The deepest the series has ever gone is 23.71, and it went there on 1 September 2026.
That date is the detail worth sitting with. It is ten days before Houthi forces completed their takeover of the Yemeni Red Sea coastline — Al Jazeera reported on 13 September that they had taken Mocha and the island of Mayyun, putting them roughly 20km from the African shore and in effective control of the strait. On that day the 7-day average read 27.29, three and a half ships a day higher than the low set before any of it happened.
We are not claiming the takeover was irrelevant to shipping. War-risk premiums, routing decisions and who dares sail under a Saudi flag are all real, and our Iran ceasefire analysis covers how fast those repricings travel. We are claiming something narrower and harder to argue with: whatever it changed, it did not change this contract’s number.
The strait that is under 10 is the other one
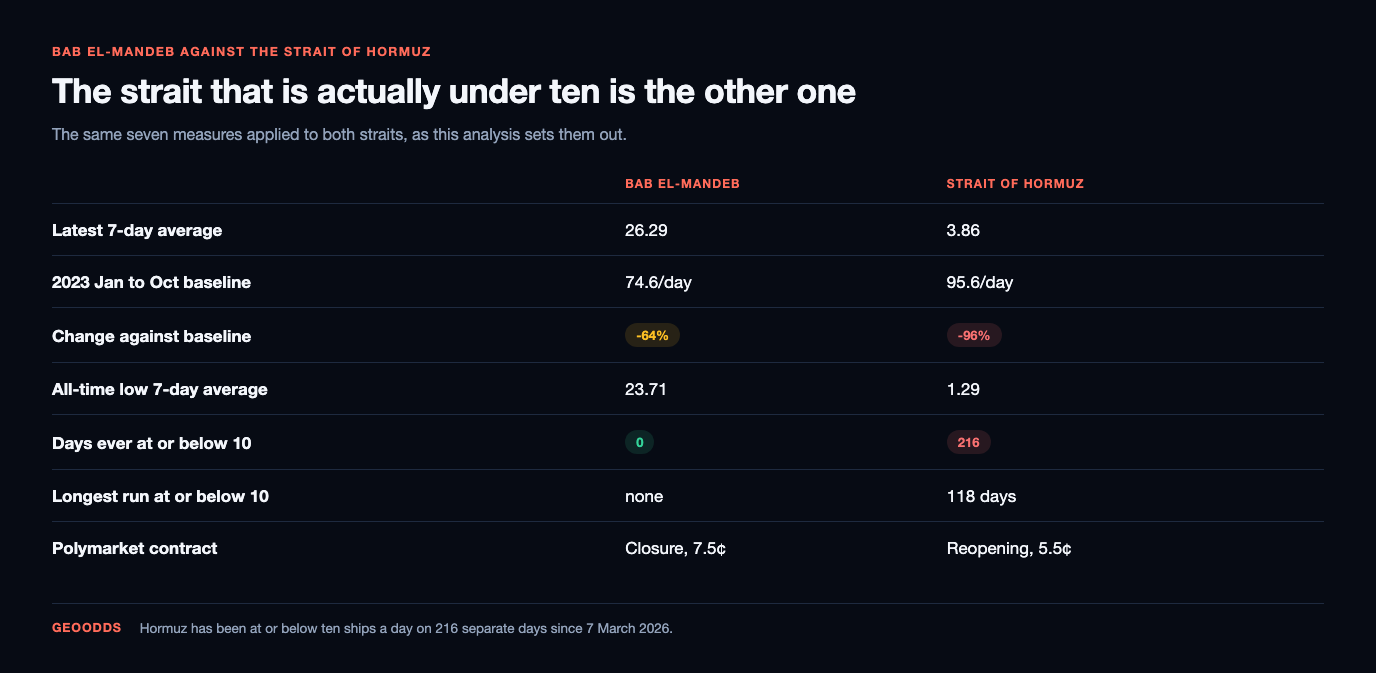
Here is where it gets strange. The same PortWatch dataset covers 29 chokepoints, and one of them has been sitting under Polymarket’s Bab el-Mandeb closure threshold almost continuously since March.
| Bab el-Mandeb | Strait of Hormuz | |
|---|---|---|
| Latest 7-day average | 26.29 | 3.86 |
| 2023 Jan–Oct baseline | 74.6/day | 95.6/day |
| Change vs baseline | −64% | −96% |
| All-time low 7-day average | 23.71 | 1.29 |
| Days ever at or below 10 | 0 | 216 |
| Longest run at or below 10 | — | 118 days |
| Polymarket contract | Closure, 7.5¢ | Reopening, 5.5¢ |
Hormuz has been at or below ten ships a day on 216 separate days since 7 March 2026, in three runs: 53 days to 28 April, 45 days to 19 June, and an unbroken 118 days from 14 July that was still going on 8 November 2026. It bottomed at 1.29 on 9 May. It reads 3.86 now.
Against a pre-war baseline of 95.6 arrivals a day, that is a 96% collapse, and it is the direct consequence of the closure and blockade sequence we traced in our Strait of Hormuz reopening analysis and our Iran invasion odds piece. Bab el-Mandeb’s 64% fall is severe. Hormuz is in a different category of event.
Polymarket has the two contracts on the wrong straits
Set the two books side by side and the asymmetry is hard to unsee. Polymarket runs an effectively closed contract on Bab el-Mandeb, where the closure threshold has never been met in nearly eight years of data. It runs a returns to normal contract on Hormuz, where traffic has been under the Bab el-Mandeb closure threshold for 118 straight days.
Neither contract is badly written. Each one asks the live question for its own strait: Bab el-Mandeb might yet collapse, Hormuz might yet recover. But a reader who finds only one of them walks away with a badly wrong picture of the Red Sea and the Gulf, and the aggregator pages that mirror these markets one at a time guarantee that is what happens.
The Hormuz reopening rung is the other number to update while we are here. It needs a 7-day average of 60 or more by 31 December, from 3.86. It traded at 5.5¢ at our snapshot. Our September piece quoted 24.5¢, so that market has written off four fifths of its remaining hope in ten weeks — and it is the only one of the pair whose price now matches what the underlying data is doing.
From 33¢ to 7.5¢: how the price gave up
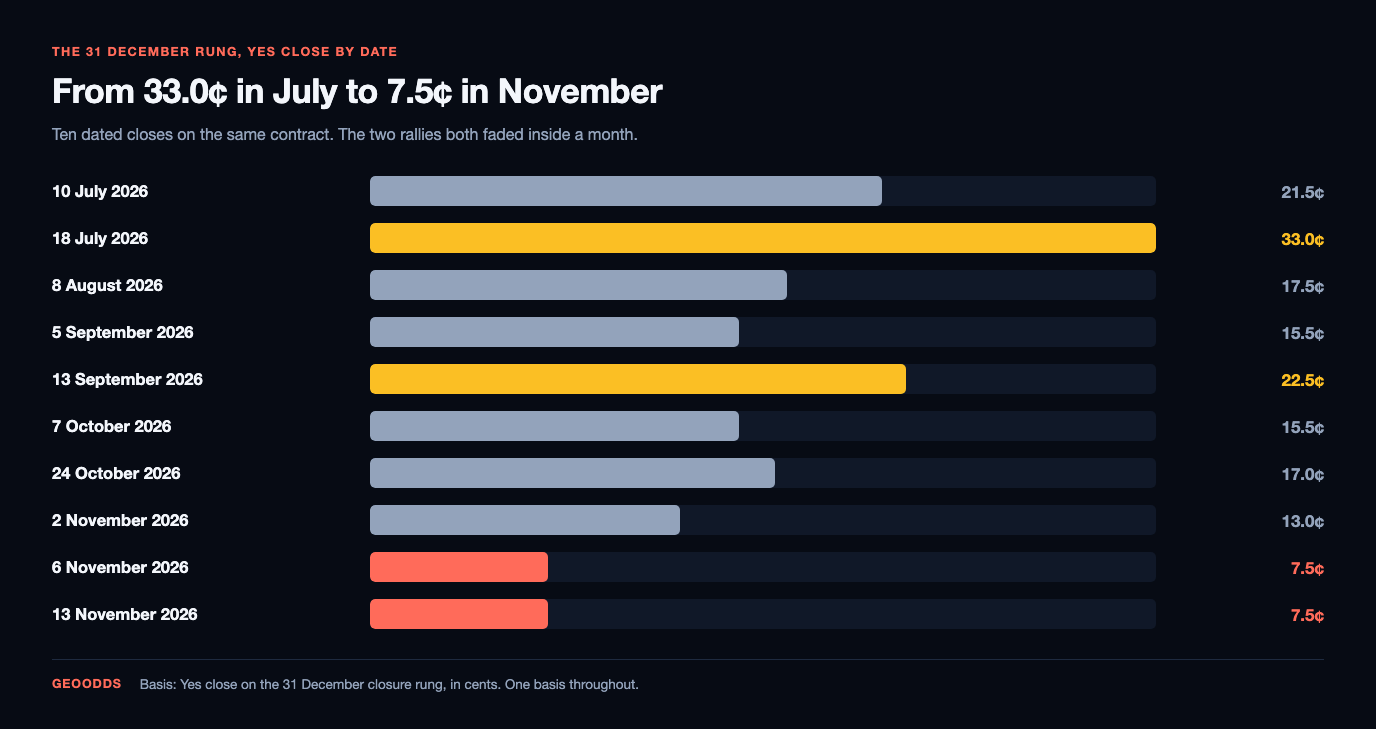
The 31 December rung has existed since 9 July, which gives four months of daily closes. They tell a cleaner story than any single snapshot, and they explain why the stale quotes on the SERP are all high.
| Date | Yes close |
|---|---|
| 10 July 2026 | 21.5¢ |
| 18 July 2026 | 33.0¢ |
| 8 August 2026 | 17.5¢ |
| 5 September 2026 | 15.5¢ |
| 13 September 2026 | 22.5¢ |
| 7 October 2026 | 15.5¢ |
| 24 October 2026 | 17.0¢ |
| 2 November 2026 | 13.0¢ |
| 6 November 2026 | 7.5¢ |
| 13 November 2026 | 7.5¢ |
Two things stand out. The 13 September bump to 22.5¢ is the coastline takeover being priced as a closure risk — the one moment the market and the headlines agreed. It faded inside a month, because the transit data never followed.
Then there is early November: 13¢ on the 2nd, 7.5¢ by the 6th. That is a 42% repricing in four days, and it lands in the same window as the 31 October rung settling No on 8 November. We are reporting the shape, not the cause — nothing in the price series attributes a move, and a thin book can travel five points on one order.
Kalshi has no Bab el-Mandeb market at all
Our usual move on a story like this is to put the two venues side by side, as we did for the midterms, because differences in rulebook usually explain differences in price. Here there is nothing to put beside it.
Kalshi lists no Bab el-Mandeb series. Searching its public series catalogue for the strait, the Red Sea, Suez, the Houthis or Yemen returns exactly two relevant books, and both are antiques: KXMAERSK (“Maersk resumes shipping in the Red Sea”) and KXSUEZ (“Suez canal closes before April?”), whose event tickers are dated to March 2024 and which have no open markets.
Its one live strait ladder is KXHORMUZAVG-27JAN01, which resolves off the identical PortWatch 7-day average, laddered from “Above 30” to “Above 120”. At our snapshot all ten rungs were active and every one showed a null bid, a null ask, no volume and no open interest — the same dead ladder we found in September, two months on.
Traffic is 64% below pre-crisis and still nowhere near shut
Both things in that heading are true at once, and holding them together is the whole skill here. The Red Sea is badly damaged as a trade route. It is also, by the measure this contract uses, not closed and not close to closed.
| Month 2026 | Bab el-Mandeb | Hormuz |
|---|---|---|
| January | 33.5 | 58.5 |
| February | 36.8 | 78.3 |
| March | 35.5 | 3.2 |
| April | 36.7 | 7.1 |
| May | 36.1 | 3.9 |
| June | 36.6 | 12.9 |
| July | 33.6 | 10.2 |
| August | 27.4 | 4.7 |
| September | 26.6 | 3.6 |
| October | 27.9 | 3.8 |
| November (1–8) | 26.8 | 3.5 |
Bab el-Mandeb ran in the mid-30s for the first seven months of 2026, then stepped down to the high 20s in August and has stayed there. That August step is the real event in this series, and it has held for four months — a lower plateau, not a slide. A slide gets you to 10. A plateau at 27 does not.
Hormuz, in the same table, shows what a genuine collapse looks like: 78.3 in February, 3.2 in March. One month. If Bab el-Mandeb were going to do that, the shape would be unmistakable within a fortnight, and it is exactly what the 30 November rung at 3.35¢ is pricing against.
What would have to happen in the next 48 days
A Hormuz-shaped month. The only precedent in the dataset for a fall of this size is the Hormuz closure, and that took a declared closure plus a naval blockade to produce. Bab el-Mandeb would need a comparable step — a general embargo rather than the Saudi-linked targeting reported so far, or an insurer withdrawal that strands the remaining 27 ships a day.
A carrier exit, not a carrier warning. The traffic that remains is the operators who never left. Watch for the large liner networks suspending Suez routings outright, which is the mechanism that took the number from 74 to the low 30s in 2024 — and note it did not get past 23.71 even then.
A revision, which cuts both ways. The contract counts revisions published inside its window, and a qualifying reading cannot be disqualified by a later revision. In a market priced at 7.5¢, a data artefact is a bigger share of the remaining probability than it sounds.
Nothing, which is what eleven rungs have paid. If you only track one number here, track the PortWatch 7-day average rather than the price — it is published, it is free, and it is the thing that settles the bet. Our biggest daily movers page and the analysis index track where the rest of the money is going, and the live Bab el-Mandeb board refreshes every ten minutes.
Related articles
- Strait of Hormuz reopening odds 2026: what “back to normal” means
- Iran ceasefire odds 2026: Qeshm broke one of two
- 2026 Senate odds: oil under $80 costs 19 points
- Will the US invade Iran in 2026? The odds, and Kharg
- Iran nuclear deal odds 2026: from 62¢ to 13¢
- How GeoOdds reads prices, volume and resolution rules
New to prediction markets?
New traders get a $20 bonus
Deposit $10 on Polymarket and get a $20 trading bonus to put behind your first call.
See the live Bab el-Mandeb board on Polymarket →New Polymarket users only. Bonus is trading credit, expires 30 days after it lands, and terms are set by Polymarket — check the current offer at signup. 18+. Fee-free markets. GeoOdds earns a commission on signups through this link.
Frequently asked questions
What are the Bab el-Mandeb odds for 2026?
At 21:07 UTC on 13 November 2026, Polymarket pays 7.5¢ that the Bab el-Mandeb Strait is effectively closed by 31 December 2026 and 3.35¢ by 30 November. Eleven earlier rungs on the same board, from 31 March to 31 October, have all settled No. The event has traded $18.1 million since March.
How does Polymarket decide the Bab el-Mandeb Strait is “effectively closed”?
It is a data threshold, not a judgement. The contract resolves Yes if IMF PortWatch publishes a 7-day moving average of transit calls — “Arrivals of Ships” — at or below 10 for any date in the rung's window. Container, dry bulk, roll-on/roll-off, general cargo and tanker vessels all count, and ships PortWatch does not report are not considered.
Has the Bab el-Mandeb 7-day average ever reached 10?
No. We pulled every daily PortWatch record for the strait from 1 January 2019 to 8 November 2026 — 2,869 days — and computed the 7-day average the contract names. It has never been at or below 10. The lowest reading in the whole series is 23.71, set on 1 September 2026, and the latest is 26.29.
Did the Houthi takeover of the Yemeni coast close the strait?
Not by this measure. Al Jazeera reported on 13 September 2026 that Houthi forces had completed their takeover of Yemen's Red Sea coastline, taking Mocha and the island of Mayyun (Perim) and placing them in effective control of the strait. The PortWatch 7-day average on 13 September was 27.29 — higher than the 23.71 recorded twelve days earlier, before any of it happened.
Which strait is actually closed, Bab el-Mandeb or Hormuz?
Hormuz, on the identical measure. Its 7-day average has sat at or below 10 on 216 days since 7 March 2026, including an unbroken run from 14 July to 8 November, and reads 3.86 now against a 2023 baseline of 95.6 ships a day. Bab el-Mandeb reads 26.29 against its own baseline of 74.6.
Does Kalshi have a Bab el-Mandeb market?
No. Kalshi lists no Bab el-Mandeb series. Its only two Red Sea series, KXMAERSK and KXSUEZ, are 2024-vintage events with no open markets, and its KXHORMUZAVG ladder — which uses the same PortWatch 7-day average, laddered from “Above 30” to “Above 120” — showed ten active rungs with no bid, no ask, no volume and no open interest at our snapshot.
So is 7.5¢ too high or about right?
We are not going to call it mispriced, and nor should anyone reading a single number. What we will say is what the price is buying: a 62% fall from the latest published average, inside a window with 53 days of unpublished data left, to a level the series has not reached in almost eight years. That is the bet, stated plainly, and it is a far longer shot than the SERP's stale 21-33% quotes suggest.
Sources: prices and resolution text from the Polymarket Gamma and CLOB public APIs (event 276527, every rung plus daily closes for the 31 December rung, and event 455875 for the paired Hormuz contract), read at 13 November 2026, 21:07 UTC; the Bab el-Mandeb board carries the operative text quoted above. Transit figures are our own computation from IMF PortWatch, the resolution source the contract names, taken from its public daily chokepoints service — 2,869 daily records each for Bab el-Mandeb (chokepoint4) and the Strait of Hormuz (chokepoint6), 1 January 2019 to 8 November 2026, the latest date published at our snapshot. The 7-day moving averages, baselines and run lengths are arithmetic on those records, computed to the contract’s own definition, and are not forecasts. Kalshi series and market status come from the Kalshi public markets API. The Houthi advance on the Yemeni coastline, the capture of Mocha and Mayyun (Perim) and the resulting position relative to the strait are as reported by Al Jazeera on 13 September 2026; this page does not assert who controls the strait, only what the transit data did around those dates. Polymarket volume and liquidity are dollars; Kalshi carries no published volume on the ladder discussed, and the two venues’ figures are never added here. Live numbers are on the market pages, which refresh every 10 minutes. Nothing here is financial or betting advice.